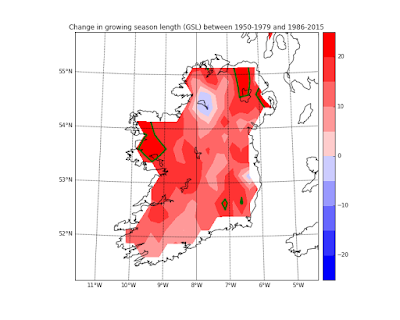
In March 2016, the UK Met Office posted a
News Release saying that the growing season during the past 10 years is on average 29 days longer than between 1961-1990.
The WMO/ETCCDI report “Guidelines on Analysis of extremes in a changing climate in support of informed decisions for adaptation” [Klein Tank et al., 2009] defines growing season length as the annual count of days between first span of at least six days where TG (daily mean temperature) > 5ºC and first span in second half of the year of at least six days where TG < 5ºC: Count the annual (1 Jan to 31 Dec in Northern Hemisphere) number of days between the first occurrence of at least six consecutive days where T G > 5ºC and the first occurrence after 1 July of at least six consecutive days where TG < 5ºC.
Gridded TG data area available to download as NetCDF files for
E-OBS Version 14.0. Gridded
E-OBS climate indices are also available to download as NetCDF files on a regular 0.25 degree grid. These include Annual Growing Season Length (GSL), as define by ETCCDI. Note that GSL is based on E-OBS Version 11, while TG data are from the latest version (V14). Differences in versions are described for
v14 here and for
older versions here. Visual comparisons of the plots they have produced don’t show any noticeable differences in mean temperatures over Ireland, but if I find differences between my calculated GSL values (v14) and the ECAD GSL values (v11), I should check version differences more closely.
The Plan


